
If shipping is an indicator of the direction the economy is heading, look out.
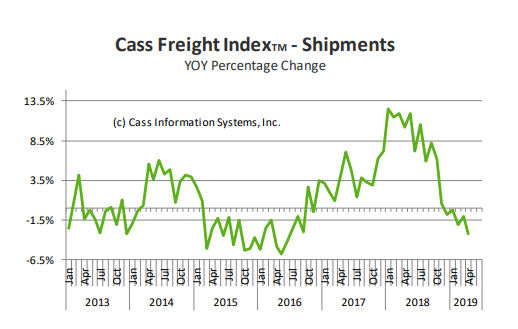
The Cass Freight Index report for the month ended April 2019 paints a dire picture for freight heading into the end of the second quarter. The report says that “continued decline” in the freight index remains a concern, pointing out that shipments have fallen 3.4% year over year while expenditures have risen 6.2%. Sequentially on a monthly basis, shipments are down 0.3% while expenditures ticked up 0.7%.
From the report, Cass Information Systems says:
- When the December 2018 Cass Shipments Index was negative for the first time in 24 months, we dismissed the decline as reflective of a tough comparison. When January 2019 was also negative, we again made rationalizations. Then February was down -2.1% and we said, “While we are still not ready to turn completely negative in our outlook, we do think it is prudent to become more alert to each additional incoming data point on freight flow volume, and are more cautious today than we have been since we began predicting the recovery of the U.S. industrial economy and the rebirth of the U.S. consumer economy in the third quarter of 2016.”
- When March was down -1.0%, we warned that we were preparing to ‘change tack’ in our economic outlook.
- With April down -3.2%, we see material and growing downside risk to the economic outlook. We acknowledge that: all of these still relatively small negative percentages are against extremely tough comparisons; the two-year stacked increase was 6.6% for April; and the Cass Shipments Index has gone negative before without being followed by a negative GDP. We also submit that at a minimum, business expansion plans should be moderated or have contingency plans for economic contraction included.
- The initial Q1 ’19 GDP report of 3.2% suggests the economy is growing faster than is reflected in the Cass Shipments Index. Our devolvement of GDP explains why the apparent disconnect is not as significant as it first appears.
- The weakness in spot market pricing for many transportation services, especially trucking, is consistent with the negative Cass Shipments Index and, along with airfreight and railroad volume data, heightens our concerns about the economy and the risk of ongoing trade policy disputes.
Additionally, the report notes that it is “concerned about the severe declines in international airfreight volumes (especially in Asia) and the recent swoon in railroad volumes in auto and building materials. We see the weakness in spot market pricing for transportation services, especially in trucking, as consistent with and a confirmation of the negative trend in the Cass Shipments Index. As volumes of chemical shipments have lost momentum in recent weeks, despite the rally in the price of WTI crude, our concerns of the global slowdown spreading to the U.S., and the trade dispute reaching a ‘point of no return’ from an economic perspective, grow.”
The report also acknowledges what it calls “storm clouds on the economic horizon”, including:
- The tariffs — and threats of even higher tariffs — with China, the world’s second largest economy (even though the latest headlines and tweets keep suggesting there will be a resolution). Tariffs have throttled export volumes in some areas of the U.S. economy, most notably agriculture exports and other select raw materials. We maintain the view that there will be a resolution; that there will be a trade deal because both China and the U.S. have to reach one. But the recent Asian airfreight volumes suggest a growing risk that one or more of the Asian economies (China, South Korea, Singapore) is already sliding into recession. Risk has gotten worse.
- The decline in WTI crude in December to as low as $42.50 a barrel. This did not fall below the marginal cost of production for fracked crude in almost all areas of the U.S., but it made it less profitable and significantly lowered the incentive to drill ever more holes, effectively slowing the rate of growth in the industrial economy. Crude’s ongoing rally (WTI above $61 as we write this) gives us reprieve. Continued strength in the price of crude makes us more confident in our positive outlook for the U.S. industrial economy and less worried about global demand. Risk has gotten so much better that it has arguably become a positive.
- Consistent with disappointing housing starts (down -10.6% in February and – 13.0% in March) and lackluster auto sales (down -4.5% in April and -2.2% YTD), spot pricing in transportation has declined dramatically. Especially in trucking, spot pricing has reached levels below contract that will drive weakness in contract pricing and eliminate, or at least significantly reduce, all capital investment other than maintenance cap ex. This puts further downward pressure on growth in coming periods.
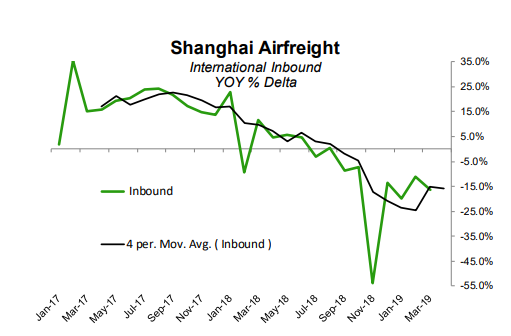
The report also observes a stunning falloff in Asian airfreight volumes:
Asian airfreight volumes were essentially flat from June to October 2018, but have since deteriorated at an accelerating pace (November -3.5%, December -6.1%, January – 5.4%, February -13.3%, March -3.3%). If the overall volume wasn’t distressing enough, the volumes of the three largest airports (Hong Kong, Shanghai, and Incheon) are experiencing the highest rates of contraction. Even more alarming, the inbound volumes for Shanghai have plummeted. This concerns us since it is the inbound shipment of high value/low density parts and pieces that are assembled into the high-value tech devices that are shipped to the rest of the world. Hence, in markets such as Shanghai, the inbound volumes predict the outbound volumes and the strength of the high-tech manufacturing economy.
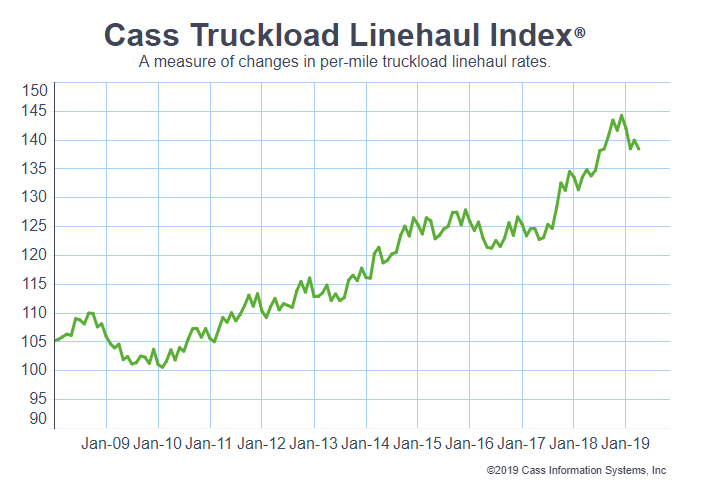
The report was published a few days after ACT Research released their May installment of their ACT Freight Forecast, U.S. Rate and Volume OUTLOOK report covering the truckload, intermodal, LTL and last mile sectors. Its outlook report was also pessimistic, as it noted that dry van truckload spot rates, net of fuel, were down 19% year over year in April and more than 3% on a monthly sequential basis.
ACT analyst Kenny Vieth said: “We continue to believe the accelerating supply-demand imbalance and large new vehicle inventories will trigger a correction sometime in the latter half of this year. Hence, we remain cautious into the end of this year and early next.”
Tim Denoyer, ACT Research’s vice president and senior analyst wrote: “While we see reasons for recovery in the second half of 2019, escalating trade tensions raise the risk of freight recession. Class 8 tractor retail sales are on fire, adding capacity to the market at an unfortunate time for truckers. Shippers are increasingly targeting freight cost savings, likely emboldened by attractive rates in the spot market.”

In early May we noted that Class 8 heavy truck orders were not “on fire” but, rather, had been decimated, down 57% year over year.
North American Class 8 net order data showed the industry booked 14,800 units in April, down 57% from a year-ago. The number also marks a sequential decrease of 6.2% from March. The decline is being blamed on companies filling orders from a bloated backlog of last year’s record purchases and buyers juggling remaining orders. The numbers from last month were the lowest for an April since 2016.
Year to date, the numbers continue to look ugly. There have been 63,000 trucks ordered, a 63% percent decline from the 169,186 orders placed during the same period in 2018. And it doesn’t look like the rest of the year is going to get any better.
Vieth concluded:
“We continue to contend that current order weakness has more to do with very large Class 8 backlogs and orders already booked, than with the evolving supply-demand balance. Of course, contracting freight volumes, falling freight rates, and strong Class 8 capacity additions suggest that the supply-demand balance will become an issue later this year.”
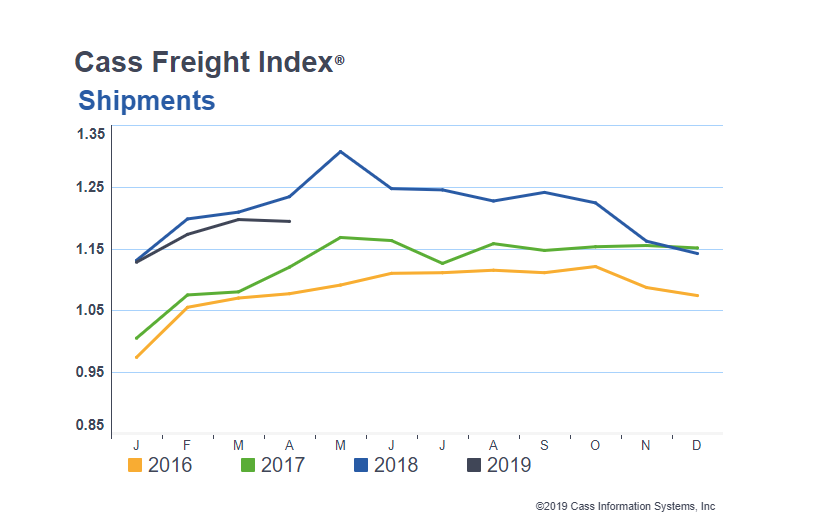
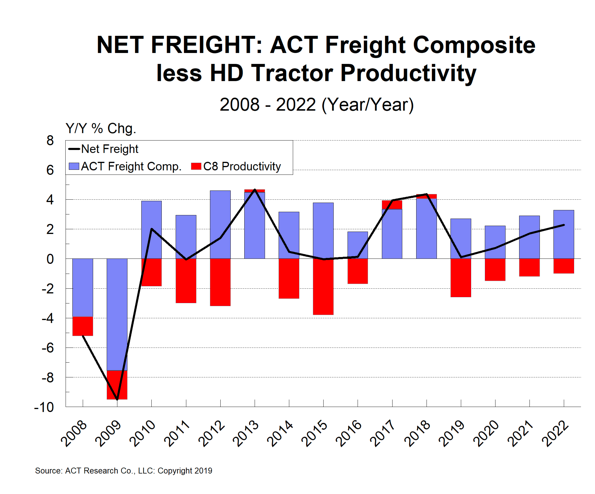
Finally, for all those who find the above too long or involved, here is the one chart that summarizes everything said above without needing much commentary.