

We are finally getting to the point where the rubber hits the recessionary road.
Now that Wall Street is convinced that hawkish global central banks (the top risk in the latest BofA Fund Manager Survey) will spark a global recession (the second highest risk in the FMS)…
… and as a result, peak inflation is now consensus with a whopping net 68% of respondents – a record high – expect inflation rates to fall in the coming quarters…

… it seems that fears of stagflation are gradually giving way to something just as concerning: a global recession.
Of course, a global recession is not good for Wall Street business nor stock prices, which is why Wall Street was bound to stage a spirited defense against the reality that a recession has already started, at least until the NBER makes the current recession official, and is why we get defensive articles such as this one in Bloomberg from this morning: “Goldman, JPMorgan Strategists See Recession Fears as Overblown”…
… although one could be forgiven to take such pro-establishment propaganda seriously any more when a quick google search reveals farcical humor such as this from October.
So realizing that most of its clients are sophisticated enough to see through its “base case” bullish, Goldman (if not JPMorgan) has already started setting the stage for what is coming, and two days after publishing a list of 20 stocks that should thrive in the “coming recession”, Goldman has quietly started handing out a “Recession Manual” for US stocks (available to professional subscribers) to clients.
To be sure, it’s a recession which Goldman is pretty certain won’t happen (if only not to piss off the Biden admin): as Goldman’s chief equity strategist David Kostin hedges in the second sentence of the report, “our economists estimate a 35% probability that the US economy will enter a recession during the next two years and believe the yield curve is pricing a similar likelihood of a contraction.”
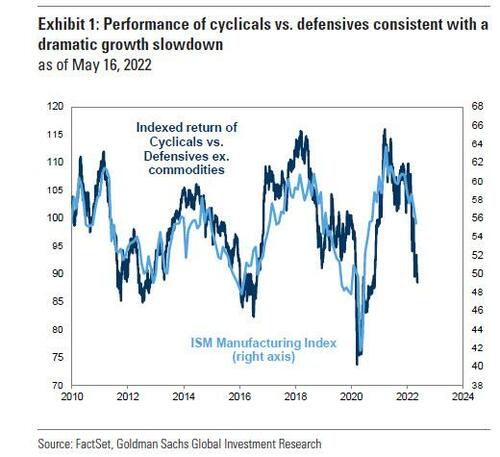
And yet, despite Goldman’s best efforts to mitigate the painfully obvious endgame, the bank goes on to admit that rotations within the US equity market indicate that investors are pricing elevated odds of a downturn compared with the strength of recent economic data. One such place is the relative performance of cyclical stocks vs. defensive stocks which has declined by 17% since January (-19% vs. -2%). The relative performance of these two factors has closely tracked the level of the ISM index for more than a decade. The ISM currently stands at 55, but the relative performance of cyclicals vs. defensives would imply a level below 50, i.e. a contraction and thus, a recession.
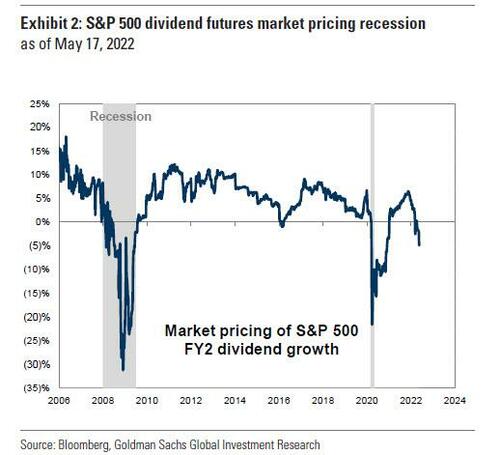
Additionally, Kostin reveals that dividend futures market implies S&P 500 dividends will decline by nearly 5% in 2023 (this matters because during the last 60 years, S&P 500 dividends have not declined outside of a recession).
In other words, even though Goldman says that “a recession is not inevitable”, it also admits that “clients are constantly asking what to expect from equities in the event of a recession.“
So what should Goldman clients expect? In its report, Goldman discusses how S&P 500 price, earnings, valuations, and sector and factor performance have fared in past recessions. And while there is a lot of information in the full report, we take a more detailed look at some of the report highlights starting with…
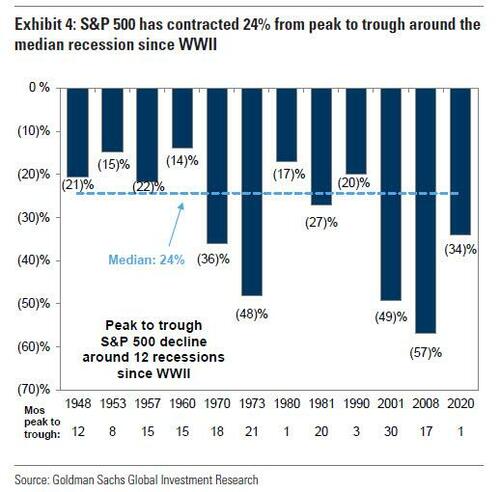
Price: Across 12 recessions since World War II, the S&P 500 index has contracted from peak to trough by a median of 24%. A decline of this magnitude from the S&P 500 peak of nearly 4800 in January 2022 would bring the S&P 500 to approximately 3650 (11% below current levels). The average decline of 30% would reduce the S&P 500 to 3360 (-18% from today).
Timing: Across the same 12 experiences since WWII, the equity market has begun to price a recession on average 7 months prior to the official start of the recession per NBER’s designation. In all but one instance, the sequence of events was the same: The market peaked prior to the recession and then bottomed prior to the end of the recession.
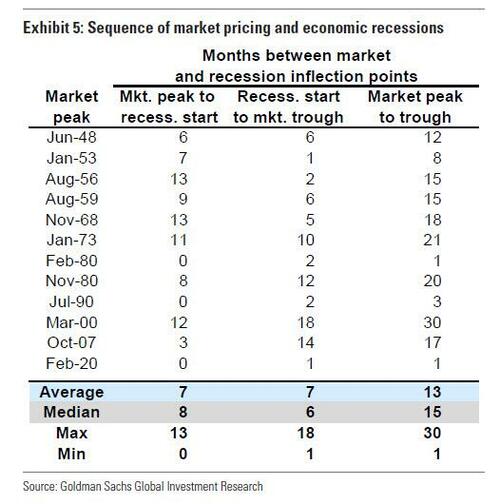
As an aside, the 2000 recession was the only experience that departed from this pattern. Back then, the market continued to decline well after the economic recession ended, troughing a full 8 months after the recession ended and a full 30 months after its pre-recession peak.
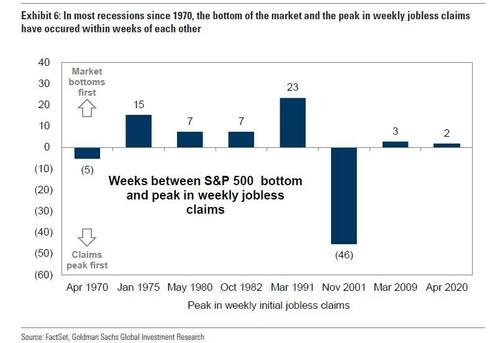
Labor Market: According to Goldman, bottom of the equity market has generally exhibited a relationship with the peak in weekly jobless claims. Since 1970, the S&P 500 has reached its local trough within weeks of the peak in weekly jobless claims. In most experiences, the market bottomed just before jobless claims reached their peak. That may be concerning because while claims just hit a 4 month high, at 218K, they have a long way to go to get back to historical average not to mention the records hit during the covid crash.
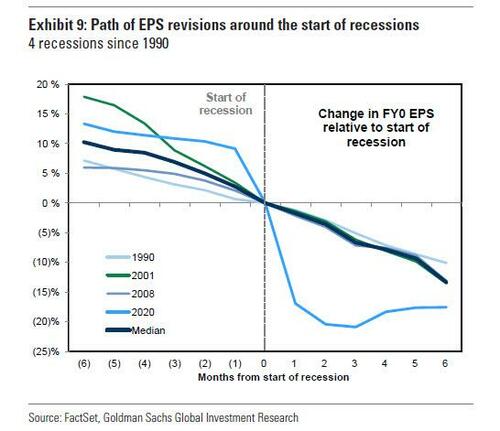
Earnings: Since 1948, S&P 500 earnings have dropped from peak to trough around recessions by a median of 13%. EPS have recovered by a median of 17% four quarters after troughing. In terms of timing, recessions since 1990 provide a guide for the path of EPS revisions around a recession.

During the last four recessions, the typical revision to consensus EPS estimates during the 6 months prior to the start of a recession has ranged from -6% to -18%, with a median of -10%. During the 6 months following the start of the recession, analysts reduced EPS estimates by an additional 13%. During the 12-month period surrounding the start of a recession, analysts reduced estimates by a median of 22%.
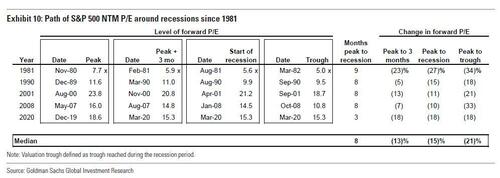
Valuation: The S&P 500 forward P/E multiple has contracted by a median of 21% between its pre-recession peak and its eventual trough. During the typical recession since 1980, the index P/E multiple peaked 8 months in advance of the onset of a recession and declined by 15% between its pre-recession peak and the beginning of the recession.
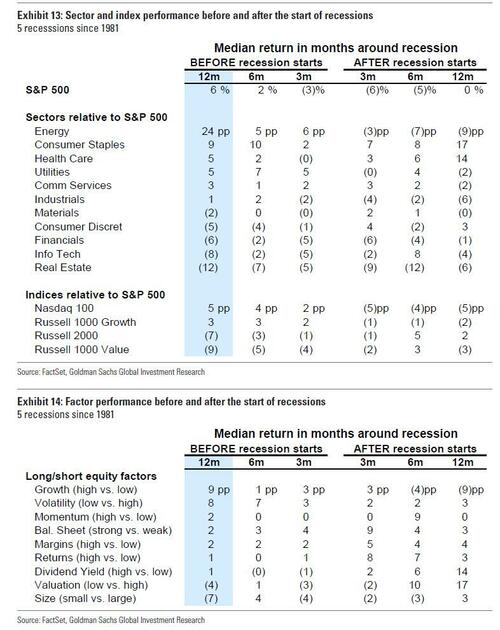
Sectors: During the 12 months before a recession, defensive sectors and “quality” factors have generally outperformed. Across 5 recessions since 1981, the average experience saw Energy, Consumer Staples, Health Care, and Utilities outperform the index.
There is more in the full Goldman Recession Manual available to professional subscribers.


