
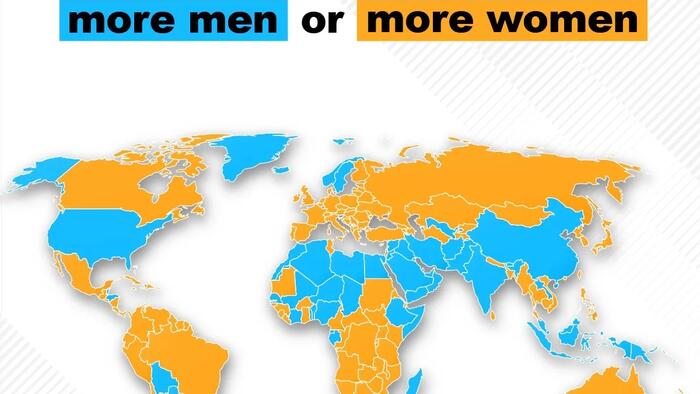
Why do some countries have noticeably more men than women, while others have the opposite pattern?
This map, via Visual Capitalist’s Jeff Desjardins, shows which countries have male- or female-majority populations using World Population Review data on the number of males per 100 females.
While sex ratios at birth differ only slightly, demographic forces can produce striking imbalances over time.
Countries Where There Are More Men
Of the 233 countries and territories in the dataset, men outnumber women in just 33%.
| Rank | Country | Ratio (Males per 100 females) |
|---|---|---|
| 1 | 🇶🇦 Qatar | 243.7 |
| 2 | 🇦🇪 United Arab Emirates | 175.0 |
| 3 | 🇴🇲 Oman | 166.5 |
| 4 | 🇧🇭 Bahrain | 163.2 |
| 5 | 🇲🇻 Maldives | 159.8 |
| 6 | 🇰🇼 Kuwait | 156.5 |
| 7 | 🇸🇦 Saudi Arabia | 152.0 |
| 8 | 🇪🇭 Western Sahara | 122.0 |
| 9 | 🇸🇨 Seychelles | 122.0 |
| 10 | 🇵🇼 Palau | 116.2 |
| 11 | 🇧🇹 Bhutan | 114.5 |
| 12 | 🇧🇳 Brunei | 112.9 |
| 13 | 🇲🇵 Northern Mariana Islands | 112.7 |
| 14 | 🇬🇶 Equatorial Guinea | 111.2 |
| 15 | 🇬🇱 Greenland | 110.2 |
| 16 | 🇲🇾 Malaysia | 109.5 |
| 17 | 🇲🇹 Malta | 108.2 |
| 18 | 🇸🇬 Singapore | 106.8 |
| 19 | 🇫🇴 Faroe Islands | 106.5 |
| 20 | 🇮🇳 India | 106.4 |
| 21 | 🇯🇴 Jordan | 106.0 |
| 22 | 🇵🇬 Papua New Guinea | 105.5 |
| 23 | 🇮🇸 Iceland | 105.2 |
| 24 | 🇹🇻 Tuvalu | 105.0 |
| 25 | 🇸🇧 Solomon Islands | 104.6 |
| 26 | 🇦🇩 Andorra | 104.4 |
| 27 | 🇲🇭 Marshall Islands | 104.4 |
| 28 | 🇩🇿 Algeria | 104.0 |
| 29 | 🇨🇳 China | 103.6 |
| 30 | 🇳🇷 Nauru | 103.5 |
| 31 | 🇨🇻 Cape Verde | 103.4 |
| 32 | 🇱🇾 Libya | 103.3 |
| 33 | 🇻🇨 Saint Vincent and the Grenadines | 103.2 |
| 34 | 🇨🇮 Ivory Coast | 103.2 |
| 35 | 🇮🇷 Iran | 103.2 |
| 36 | 🇳🇪 Niger | 103.1 |
| 37 | 🇸🇳 Senegal | 103.0 |
| 38 | 🇬🇦 Gabon | 102.8 |
| 39 | 🇾🇪 Yemen | 102.7 |
| 40 | 🇵🇰 Pakistan | 102.5 |
| 41 | 🇳🇬 Nigeria | 102.5 |
| 42 | 🇬🇺 Guam | 102.3 |
| 43 | 🇦🇫 Afghanistan | 102.1 |
| 44 | 🇵🇫 French Polynesia | 102.0 |
| 45 | 🇪🇬 Egypt | 101.9 |
| 46 | 🇺🇿 Uzbekistan | 101.8 |
| 47 | 🇻🇺 Vanuatu | 101.8 |
| 48 | 🇲🇱 Mali | 101.8 |
| 49 | 🇹🇱 Timor-Leste | 101.7 |
| 50 | 🇧🇿 Belize | 101.7 |
| 51 | 🇳🇴 Norway | 101.7 |
| 52 | 🇸🇪 Sweden | 101.6 |
| 53 | 🇲🇦 Morocco | 101.6 |
| 54 | 🇼🇸 Samoa | 101.6 |
| 55 | 🇨🇾 Cyprus | 101.5 |
| 56 | 🇱🇺 Luxembourg | 101.5 |
| 57 | 🇦🇸 American Samoa | 101.5 |
| 58 | 🇹🇬 Togo | 101.4 |
| 59 | 🇸🇮 Slovenia | 101.4 |
| 60 | 🇭🇳 Honduras | 101.3 |
| 61 | 🇰🇲 Comoros | 101.1 |
| 62 | 🇺🇸 United States | 101.0 |
| 63 | 🇮🇶 Iraq | 101.0 |
| 64 | 🇱🇦 Laos | 100.9 |
| 65 | 🇮🇩 Indonesia | 100.9 |
| 66 | 🇫🇲 Micronesia | 100.8 |
| 67 | 🇰🇾 Cayman Islands | 100.7 |
| 68 | 🇧🇯 Benin | 100.7 |
| 69 | 🇹🇩 Chad | 100.6 |
| 70 | 🇲🇬 Madagascar | 100.6 |
| 71 | 🇵🇾 Paraguay | 100.5 |
| 72 | 🇪🇹 Ethiopia | 100.4 |
| 73 | 🇸🇾 Syria | 100.4 |
| 74 | 🇸🇴 Somalia | 100.3 |
| 75 | 🇧🇴 Bolivia | 100.3 |
| 76 | 🇬🇩 Grenada | 100.3 |
| 77 | 🇹🇨 Turks and Caicos Islands | 100.0 |
| — | 🌐 Global Average | 101.2 |
Despite the smaller number of male-majority countries, there are roughly 42 million more men than women worldwide.
There are two main reasons for this.
-
First, the Gulf states are the clearest outliers. Countries such as Qatar, the UAE, Oman, and Kuwait rely heavily on temporary migrant workers employed in construction, energy, and infrastructure, industries dominated by men. Because many of these workers arrive without their families, national gender balances become unusually skewed.
-
Second, three of the world’s most populous countries, China, India, and the United States, all have more men than women. Although their ratios are less extreme, their large populations magnify the difference.
In India alone, a ratio of 106.3 men per 100 women translates into a male surplus of more than 40 million.
Countries Where There Are More Women
The largest concentration of female-majority countries is found across Eastern Europe and the Caucasus. Former Soviet states account for seven of the 12 countries and territories with the lowest ratios of men to women.
| Rank | Country | Ratio (Males per 100 females) |
|---|---|---|
| 1 | 🇭🇰 Hong Kong | 81.7 |
| 2 | 🇬🇵 Guadeloupe | 82.4 |
| 3 | 🇲🇶 Martinique | 82.8 |
| 4 | 🇲🇩 Moldova | 85.1 |
| 5 | 🇲🇴 Macau | 85.2 |
| 6 | 🇲🇫 Saint Martin | 85.5 |
| 7 | 🇷🇺 Russia | 86.4 |
| 8 | 🇦🇲 Armenia | 86.5 |
| 9 | 🇱🇻 Latvia | 86.8 |
| 10 | 🇺🇦 Ukraine | 87.1 |
| 11 | 🇧🇾 Belarus | 87.2 |
| 12 | 🇬🇪 Georgia | 87.4 |
| 13 | 🇧🇱 Saint Barthelemy | 88.5 |
| 14 | 🇵🇷 Puerto Rico | 88.7 |
| 15 | 🇹🇴 Tonga | 89.5 |
| 16 | 🇦🇼 Aruba | 89.5 |
| 17 | 🇱🇹 Lithuania | 89.6 |
| 18 | 🇻🇮 United States Virgin Islands | 89.7 |
| 19 | 🇻🇬 British Virgin Islands | 89.8 |
| 20 | 🇷🇸 Serbia | 90.0 |
| 21 | 🇷🇪 Reunion | 90.4 |
| 22 | 🇸🇻 El Salvador | 90.5 |
| 23 | 🇼🇫 Wallis and Futuna | 90.5 |
| 24 | 🇳🇵 Nepal | 90.7 |
| 25 | 🇦🇬 Antigua and Barbuda | 90.9 |
| 26 | 🇵🇹 Portugal | 90.9 |
| 27 | 🇪🇪 Estonia | 91.0 |
| 28 | 🇧🇦 Bosnia and Herzegovina | 91.0 |
| 29 | 🇧🇸 Bahamas | 91.1 |
| 30 | 🇨🇼 Curacao | 91.2 |
| 31 | 🇰🇳 Saint Kitts and Nevis | 91.4 |
| 32 | 🇿🇼 Zimbabwe | 91.4 |
| 33 | 🇾🇹 Mayotte | 92.0 |
| 34 | 🇧🇧 Barbados | 92.1 |
| 35 | 🇳🇺 Niue | 92.3 |
| 36 | 🇭🇺 Hungary | 92.6 |
| 37 | 🇬🇫 French Guiana | 92.9 |
| 38 | 🇨🇫 Central African Republic | 92.9 |
| 39 | 🇲🇪 Montenegro | 92.9 |
| 40 | 🇭🇷 Croatia | 93.3 |
| 41 | 🇱🇰 Sri Lanka | 93.7 |
| 42 | 🇧🇬 Bulgaria | 93.7 |
| 43 | 🇵🇱 Poland | 93.8 |
| 44 | 🇷🇴 Romania | 93.9 |
| 45 | 🇫🇷 France | 94.1 |
| 46 | 🇬🇷 Greece | 94.1 |
| 47 | 🇲🇽 Mexico | 94.1 |
| 48 | 🇸🇽 Sint Maarten | 94.3 |
| 49 | 🇺🇾 Uruguay | 94.3 |
| 50 | 🇦🇮 Anguilla | 94.3 |
| 51 | 🇲🇿 Mozambique | 94.5 |
| 52 | 🇹🇭 Thailand | 94.5 |
| 53 | 🇰🇮 Kiribati | 94.7 |
| 54 | 🇿🇦 South Africa | 94.7 |
| 55 | 🇬🇾 Guyana | 94.7 |
| 56 | 🇲🇰 North Macedonia | 94.8 |
| 57 | 🇱🇧 Lebanon | 94.8 |
| 58 | 🇯🇵 Japan | 95.1 |
| 59 | 🇰🇿 Kazakhstan | 95.1 |
| 60 | 🇨🇰 Cook Islands | 95.2 |
| 61 | 🇱🇸 Lesotho | 95.2 |
| 62 | 🇸🇰 Slovakia | 95.3 |
| 63 | 🇲🇼 Malawi | 95.4 |
| 64 | 🇳🇦 Namibia | 95.4 |
| 65 | 🇧🇲 Bermuda | 95.4 |
| 66 | 🇷🇼 Rwanda | 95.5 |
| 67 | 🇲🇨 Monaco | 95.7 |
| 68 | 🇮🇹 Italy | 95.9 |
| 69 | 🇻🇳 Vietnam | 96.0 |
| 70 | 🇹🇰 Tokelau | 96.1 |
| 71 | 🇰🇭 Cambodia | 96.3 |
| 72 | 🇦🇿 Azerbaijan | 96.3 |
| 73 | 🇪🇸 Spain | 96.4 |
| 74 | 🇲🇷 Mauritania | 96.5 |
| 75 | 🇫🇰 Falkland Islands | 96.6 |
| 76 | 🇸🇿 Eswatini | 96.6 |
| 77 | 🇹🇲 Turkmenistan | 96.6 |
| 78 | 🇧🇩 Bangladesh | 96.7 |
| 79 | 🇧🇷 Brazil | 96.7 |
| 80 | 🇸🇸 South Sudan | 96.7 |
| 81 | 🇸🇲 San Marino | 96.8 |
| 82 | 🇹🇯 Tajikistan | 96.9 |
| 83 | 🇳🇮 Nicaragua | 96.9 |
| 84 | 🇵🇲 Saint Pierre and Miquelon | 97.1 |
| 85 | 🇦🇹 Austria | 97.1 |
| 86 | 🇬🇧 United Kingdom | 97.1 |
| 87 | 🇱🇨 Saint Lucia | 97.1 |
| 88 | 🇨🇺 Cuba | 97.2 |
| 89 | 🇨🇿 Czechia | 97.4 |
| 90 | 🇯🇪 Jersey | 97.4 |
| 91 | 🇨🇴 Colombia | 97.4 |
| 92 | 🇳🇨 New Caledonia | 97.4 |
| 93 | 🇧🇪 Belgium | 97.5 |
| 94 | 🇻🇪 Venezuela | 97.5 |
| 95 | 🇹🇹 Trinidad and Tobago | 97.5 |
| 96 | 🇩🇪 Germany | 97.6 |
| 97 | 🇬🇬 Guernsey | 97.6 |
| 98 | 🇨🇷 Costa Rica | 97.6 |
| 99 | 🇹🇳 Tunisia | 97.6 |
| 100 | 🇪🇷 Eritrea | 97.6 |
| 101 | 🇦🇱 Albania | 97.7 |
| 102 | 🇹🇼 Taiwan | 97.7 |
| 103 | 🇰🇬 Kyrgyzstan | 97.7 |
| 104 | 🇯🇲 Jamaica | 97.7 |
| 105 | 🇭🇹 Haiti | 97.7 |
| 106 | 🇬🇼 Guinea-Bissau | 97.9 |
| 107 | 🇮🇲 Isle of Man | 97.9 |
| 108 | 🇫🇮 Finland | 97.9 |
| 109 | 🇮🇪 Ireland | 98.0 |
| 110 | 🇦🇴 Angola | 98.0 |
| 111 | 🇿🇲 Zambia | 98.1 |
| 112 | 🇰🇵 North Korea | 98.2 |
| 113 | 🇩🇯 Djibouti | 98.2 |
| 114 | 🇸🇩 Sudan | 98.2 |
| 115 | 🇬🇳 Guinea | 98.2 |
| 116 | 🇹🇿 Tanzania | 98.4 |
| 117 | 🇬🇹 Guatemala | 98.4 |
| 118 | 🇨🇩 DR Congo | 98.5 |
| 119 | 🇦🇺 Australia | 98.5 |
| 120 | 🇵🇸 Palestine | 98.5 |
| 121 | 🇫🇯 Fiji | 98.5 |
| 122 | 🇺🇬 Uganda | 98.6 |
| 123 | 🇨🇦 Canada | 98.6 |
| 124 | 🇲🇸 Montserrat | 98.6 |
| 125 | 🇦🇷 Argentina | 98.6 |
| 126 | 🇸🇹 Sao Tome and Principe | 98.7 |
| 127 | 🇧🇮 Burundi | 98.7 |
| 128 | 🇩🇴 Dominican Republic | 98.8 |
| 129 | 🇰🇪 Kenya | 98.8 |
| 130 | 🇳🇱 Netherlands | 98.8 |
| 131 | 🇨🇱 Chile | 98.8 |
| 132 | 🇨🇭 Switzerland | 98.8 |
| 133 | 🇩🇰 Denmark | 98.9 |
| 134 | 🇵🇪 Peru | 98.9 |
| 135 | 🇱🇮 Liechtenstein | 98.9 |
| 136 | 🇳🇿 New Zealand | 98.9 |
| 137 | 🇲🇲 Myanmar | 99.0 |
| 138 | 🇬🇮 Gibraltar | 99.0 |
| 139 | 🇬🇲 Gambia | 99.2 |
| 140 | 🇲🇳 Mongolia | 99.2 |
| 141 | 🇧🇼 Botswana | 99.2 |
| 142 | 🇲🇺 Mauritius | 99.3 |
| 143 | 🇧🇫 Burkina Faso | 99.3 |
| 144 | 🇮🇱 Israel | 99.3 |
| 145 | 🇨🇲 Cameroon | 99.3 |
| 146 | 🇪🇨 Ecuador | 99.4 |
| 147 | 🇰🇷 South Korea | 99.4 |
| 148 | 🇩🇲 Dominica | 99.5 |
| 149 | 🇹🇷 Turkey | 99.5 |
| 150 | 🇵🇭 Philippines | 99.5 |
| 151 | 🇸🇱 Sierra Leone | 99.5 |
| 152 | 🇸🇷 Suriname | 99.7 |
| 153 | 🇬🇭 Ghana | 99.7 |
| 154 | 🇱🇷 Liberia | 99.8 |
| 155 | 🇨🇬 Republic of the Congo | 99.9 |
| — | 🌐 Global Average | 101.2 |
Russia offers one of the region’s most prominent examples. Higher male mortality, shorter male life expectancy, historical wartime losses, and alcohol-related deaths all contribute to its ratio of 86.4 men per 100 women.
Why Sex Ratios Change Over Time
Sex ratios at birth naturally favor boys by a small margin, but populations rarely maintain that balance. Migration, life expectancy, war, public health, and economic opportunity can all reshape a country’s demographic profile over decades.
As these forces evolve, the map represents a snapshot rather than a permanent reality. Countries experiencing rapid immigration, population aging, conflict, or major improvements in healthcare may see their gender balance shift substantially from one generation to the next.