It’s a dead horse that has been beaten to a bloody pulp, but that doesn’t stop SocGen’s resident “permabear” Albert Edwards from listing what he believes are the two main reasons for the market’s “miraculous”, and record, rebound from the Christmas Eve “bear market” lows: 1) the abrupt U-turn in Fed policy reducing fears of an imminent US recession, and 2) a similar easing of Chinese monetary conditions resulting in a firming up in their economic data.
But, Edwards asks in his traditionally skeptical voice, “what happens if the market is wrong in presuming that monetary easing will bring about a rebound in the economic data? What happens if, as the savvy David Rosenberg believes, the Fed has overdone the tightening cycle and the economy is already headed into recession?”
To answer that rhetorical question, Edwards looks at recent recessions.
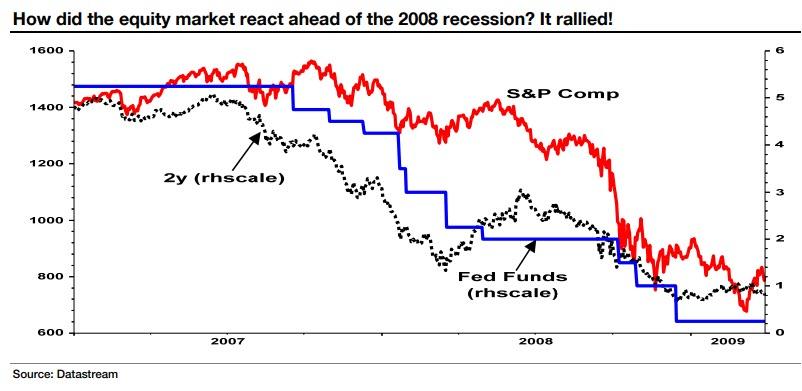
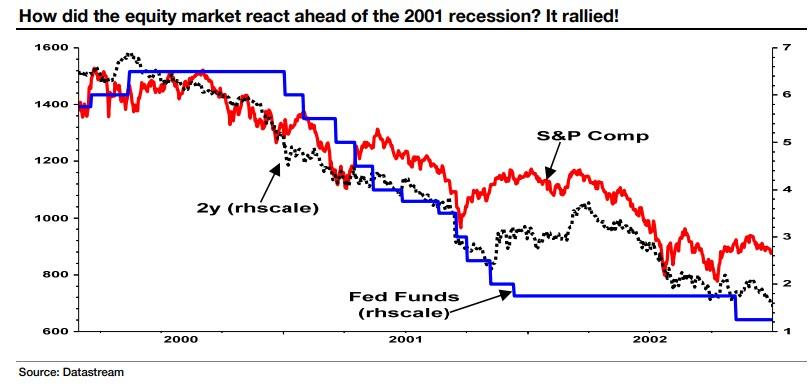
First, the SocGen strategist echoes what we showed several months ago, pointing out that equities always rally after the final Fed tightening, even when it later becomes clear that the Fed has tightened too much and recession looms. That said, the endgame is far less rosy, because despite the equity rally, the odds of a soft landing are not good since the last 13 Fed tightening cycles have ended in 10 recessions and/or financial crises.
As Edwards highlights, the experience of the last two recessions in 2008…

… and 2001…

… shows equities peaking after the end of the tightening cycle.
Edwards next makes a key point that we have repeatedly stated previously when focusing on the hypocrisy of the permabulls who say to always buy… just forget to advise when it’s time to sell:
“Traditionally the equity market rallies after the final rate hike and any rally should be sold into if you believe the economy is headed into recession. The problem is that no-one ever forecasts imminent recessions. The closely followed BAML Global Fund Manager Survey shows that in April 70% of investors surveyed expect a global recession to start in H2 2020 or later and most shocking, 86% believe yield curve inversion does not signal an impending recession!
“So are you going to pile into equities along with the dumb money? Are you feeling that lucky?” Edwards asks, and then proceeds to muse that if this equity market rally is in fact a head fake, what should we be looking out for aside from the lack of recovery in the real economic data?
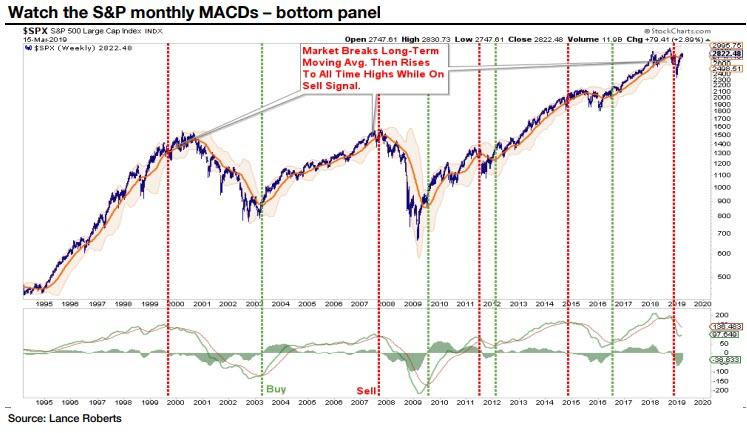
One thing that the SocGen strategist believes is worth watching is the technicals within the equity market itself. Here he highlights the work of regular Zero Hedge guest Lance Roberts who several weeks ago “presciently noted that it is entirely plausible the then ongoing equity rally could break record highs, but that this could still be consistent with a bear market starting in Q4 last year. He highlighted that instead of focusing on any record high, we should be keeping a very close eye on the monthly MACDs (Moving Average Convergence Divergence indicator). These combinations of moving averages are used in technical analysis as market timing tools and are momentum indicators highlighting market turning points.”

In the chart above, Edwards notes that prior to the two previous bear markets a sell signal was given by the monthly MACDs (shown by the red dotted vertical line). In both cases the equity market (top panel) went on to make new highs but the monthly MACDs did not confirm this as a bullish signal and it was prudent to stay out of the equity market until a buy signal was confirmed by the green vertical dotted lines. (We note that sell signals in 2012 and 2015 did not lead to full bear markets, but the indicator recorded a buy re-entry point without missing out on much upside).
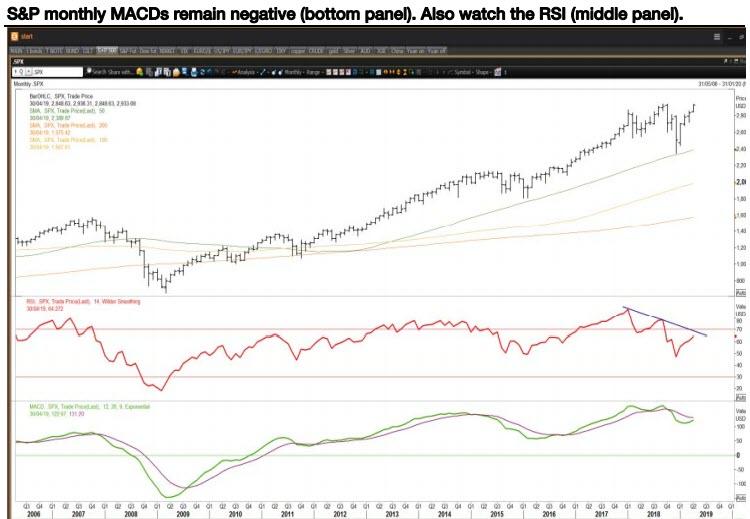
The SocGen strategist next notes that according to Roberts, one should remain cautious while the monthly MACDs remain in a sell mode, and hihglights the updated chart below where readers can see the monthly MACDs remain negative (bottom panel of three). In addition, Edwards writes, “the middle panel below shows a declining series of highs for the monthly RSI (the Relative Strength Index is another key momentum indictor link). A break above the downtrend shown below in the middle panel would be considered bullish. Until the monthly MACDs and the RSIs break upwards, the technical jury remains out on Larry Finks melt-up scenario.”

To the creator of the “Ice Age” term, the conclusion of the above is that the V-shaped rebound in equity prices is perfectly normal as the Fed tightening cycle ends “but tells us nothing about whether an economic rebound will now follow” although as he further adds, “the odds though are very much on a recession unfolding as 75% of Fed tightening cycles end that way and equities will always rally whether or not a recession is the ultimate outcome.”
What is clear to Edwards is that despite what they tell in various surveys, “investors clearly do not believe a recession is imminent and that it is safe to ignore the inverted yield curve (people said exactly the same in 2007 and 2000).” Meanwhile, the economic data remains weak/mixed apart from China, whose strength may be temporarily related to the timing of the Lunar New Year.
In conclusion, Edwards reiterates the David Rosenberg comment about the people who keep telling him they cant see any signs of an imminent recession. “I can’t tell you how much I hear that every single day. It’s like saying “I can’t smell the carbon monoxide” By the time you “see the recession”, your head’s sliced off.”
As for his own 2 cents, “if, as seems entirely plausible, we are headed into recession the advice from Gerard Minack is that the “first (Fed) rate cut in the cycle is an alarm to exit equities.”


