
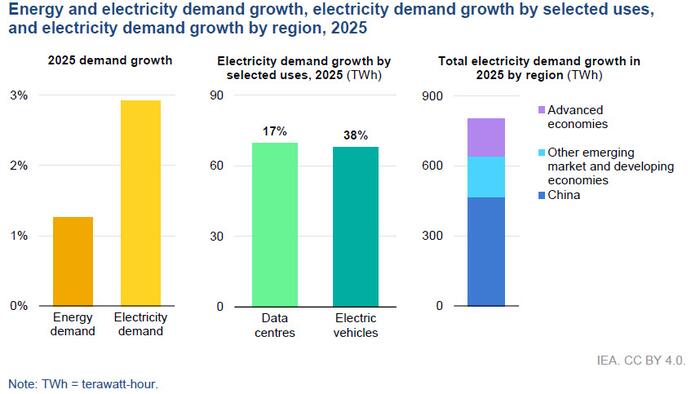
Global electricity demand rose by 3% in 2025, with growth nearly triple compared to the 1.3% increase in total energy consumption, as data centers and electric vehicles continued to push power use higher, the International Energy Agency (IEA) said in a report on Monday.
Overall global energy demand growth slowed to 1.3% in 2025, slightly below the previous decade’s average of 1.4% and significantly lower than in 2024, as global economic growth slowed and cooling demand in Asia was lower than in 2024, the IEA found in its annual Global Energy Review report published today.
While total energy demand growth cooled, electricity demand continued to grow strongly, with an annual rise of 3% last year, the IEA found.
The growth rate dropped from 4.4% in 2024, when intense heat waves in India and Southeast Asia had boosted electricity consumption. Still, the 2025 growth rate in electricity demand remained above the 2.8% annual average between 2014 and 2024 and was also well over twice the 1.3% rate of overall global energy demand growth in 2025.
The global numbers mask the important role played by China. The country’s energy intensity improvements slowed sharply from nearly 4% per year between 2010 and 2019 to just 0.6% per year from 2019 to 2024. In 2025, China’s energy intensity improvement jumped back to above 3%. Putting China aside, global energy intensity improvements would have appeared more stable in recent years. Understanding why China’s energy intensity slowed so dramatically in recent years requires further analysis. However, it appears to be in part because of adverse weather and partly due to structural changes in China’s economy after Covid-19 towards a more export- and industry-intensive model of growth.

Electricity demand in the United States grew by 2% last year, slower than the 2.8% growth seen in 2024 but more than three times as fast as the average growth rate over the previous decade, the IEA said.
The buildings sector accounted for 80% of US power demand growth in 2025, boosted in particular by rapidly-increasing data center loads. Data center power demand alone contributed around half of the entire increase in electricity consumption in the U.S. last year. A cold winter, with a nearly 10% increase in heating degree days, also supported power demand in 2025 by boosting space heating needs, according to the Paris-based agency.
Solar power met the most of the energy demand growth globally last year, followed by gas, the IEA said.

In the electricity sector, the additional 600 terawatt-hours of solar PV generation worldwide in 2025 marked the largest structural increase ever recorded in a single year for any electricity generation technology, contributing to a decline in coal-fired electricity generation globally. Battery storage was the fastest-growing power sector technology in 2025. The roughly 110 gigawatts of new battery storage capacity added during the year exceeded the largest-ever annual capacity additions for natural gas. Meanwhile over 12 gigawatts of nuclear power reactors began construction in 2025, amid renewed momentum for nuclear projects in several regions.
“Global energy demand continued to increase in 2025 against a complex economic and geopolitical backdrop, with one trend unmistakeable: the expanding electrification of economies,” said IEA Executive Director Fatih Birol.
“Electricity consumption is growing much faster than overall energy demand – and one energy source is growing much faster than any other. Solar PV accounted for over a quarter of all of the world’s energy demand growth – more than any other source, for the first time – followed right after by natural gas. In today’s rapidly shifting landscape, countries that prioritise resilience and diversification will be best placed to manage volatility and deliver secure and affordable energy in the years ahead.”
Here are the reports’ key findings summarized:
-
All major energy fuels and technologies grew in 2025 – but at very different rates. Overall global energy demand growth slowed to 1.3%, just below the average for the previous decade. Slower economic growth and slower growth in energy-intensive industries in some regions, lower cooling demand, and faster efficiency improvements all contributed to slower demand growth.
-
Solar PV, the largest single source of growth, met more than 25% of higher demand, followed by natural gas, which contributed 17%. This was the first time on record that a modern renewable source contributed the largest share of global energy demand growth. Demand for oil, natural gas and coal all grew in 2025, but at a slower rate than in 2024. Low-emissions sources combined – solar, wind, nuclear, hydropower and other renewables – contributed nearly 60% of the growth in global demand.
-
Demand growth in the United States rose to its second highest level since 2000, excluding post-recession rebound years, boosted by strong electricity demand from data centers, robust industrial growth and colder temperatures. The People’s Republic of China (hereafter, “China”) accounted for the largest overall share of global energy demand growth, but at 1.7% its growth rate slowed sharply due to the rapid growth of renewables and efficiency improvements.
-
Demand for electricity grew at well over twice the rate of energy demand, reaffirming that the world has entered the Age of Electricity. Growth of nearly 3% remained above the average of 2.8% over the last decade, but was slower than in 2024, largely due to one-off factors such as lower demand for cooling in India and Southeast Asia. Electricity demand growth was again driven by a wide range of end uses in buildings and industry. Although only contributing a small share of this total growth, demand from electric vehicles and data centres grew rapidly. In the United States, data centres made up half of all growth in electricity use.
-
Oil demand growth slowed further in 2025, increasing by 0.65 million barrels per day (mb/d) or 0.7%, down from 2024’s already muted 0.75 mb/d of growth. The increase in both years, which was in line with IEA projections, remained well below the average annual rise between 2010 and 2019 of 1.4 mb/d. The slower increase mainly reflected weaker growth in petrochemical feedstocks, notably in China, while continued growth of electric vehicles kept oil demand for road transport in check. Electric car sales continued their rapid growth, climbing over 20% to more than 20 million units – around one quarter of new car sales in 2025.
-
Gas demand growth slowed markedly in 2025, rising by around 1%, down from the 2.8% recorded in 2024, amid relatively high prices in the first half of the year. Incremental demand was largely concentrated in the United States and European Union, supported by colder winter weather, and in the Middle East, where gas use in the power sector grew quickly. By contrast, Asia Pacific demand grew at its weakest pace since the 2022 energy crisis.
-
Coal demand in 2025 grew only modestly above 2024 levels, rising by around 0.4%. In the United States, gas-to-coal switching and strong growth in electricity demand supported a 10% rise in coal use, reversing the trend of recent declines. Coal demand was flat in China: strong renewables growth pushed down coal use in electricity generation, while in industry, lower coal use in steel and cement production was offset by increased use for chemicals. Coal demand for power generation decreased in India, mostly due to an early, strong and long monsoon.
-
The increase in generation from renewables and nuclear power in 2025 exceeded the total growth in electricity supply. The 2025 increase in solar PV of 600 terawatt-hours (TWh) was the largest-ever electricity generation increase by any source in one year, outside of periods of post-crisis recovery. The rise in solar PV alone met around 70% of electricity generation growth. Renewables combined now virtually match total global generation from coal. In the European Union, the share of solar PV and wind reached 30% in 2025, surpassing that of fossil fuels for the first time. Electricity generation from natural gas and from nuclear power continued to grow at the global level in 2025.
-
Annual global renewable capacity additions rose to a record 800 gigawatts (GW), of which solar contributed 75%. Battery storage was the fastest growing power technology: capacity additions rose by around 40% in 2025 to reach almost 110 GW, more than the highest-ever annual capacity additions from natural gas. In addition, construction started on over 12 GW of nuclear power capacity in 2025.
-
Global growth in energy-related carbon dioxide (CO2) emissions slowed further in 2025, rising by around 0.4%. Emissions from China fell due to the boom in renewables, structural declines in energy-intensive industry, and overall slower demand growth. India’s energy-related CO2 emissions were flat for the first time since the 1970s, largely due to cyclical effects from a strong monsoon combined with structural growth in renewables. A cold winter and higher natural gas prices pushed up emissions in advanced economies. Due to these trends, emissions from advanced economies grew faster (+0.5%) than those from emerging market and developing economies (+0.3%) for the first time since the 1990s.
-
The rollout of clean energy technologies since 2019 avoided more than 35 exajoules of annual fossil fuel demand in 2025, equivalent to around 7% of global fossil fuel use annually. Deployment of solar PV, wind, nuclear, electric cars and heat pumps since 2019 also prevents 3 billion tonnes of CO2 annually, or around 8% of global emissions. The avoided coal demand (around 800 million tonnes of coal equivalent) equates to more than the entire coal use of India in 2025. Estimated avoided gas demand (over 260 billion cubic metres) is equivalent to almost half the global liquefied natural gas (LNG) market.