
Between 2022 and 2023, the U.S. added approximately 1.58 million people, or grew its population by about 0.5%. However, not all states grew by the same proportion.
In fact, some states saw their number of residents drop, both from net population loss (deaths outnumbering births) and from net migration (emigrants outnumbering immigrants).
Visual Capitalist’s Palla vi Rao visualizes the U.S. states with population declines between July 1, 2022 and July 1, 2023, along with the percentage change.
Data is sourced from Census Bureau estimates, released May 2024.
Ranked: Population Changes in U.S. States
A demographic reshuffling is taking place across the U.S., with states in the Northeast and the West seeing shrinking populations.
Below are the changes for all U.S. states, Washington D.C., and Puerto Rico, ranked from declines to gains in ascending order.
| U.S. State | 2023 Population | Population Change (2022–23) |
% Population Change (2022–23) |
|---|---|---|---|
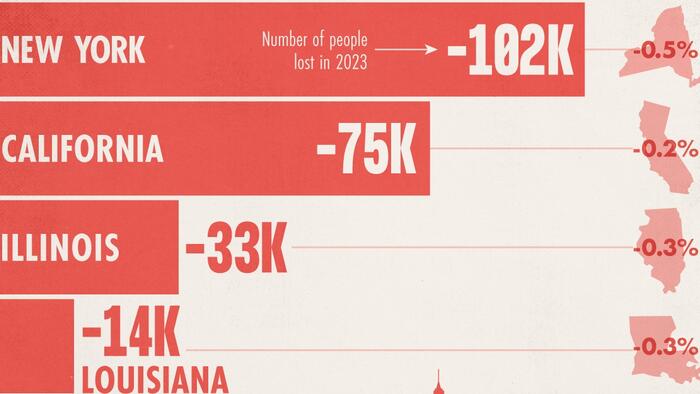
| New York | 19,571,216 | -101,984 | -0.52% |
| California | 38,965,193 | -75,423 | -0.19% |
| Illinois | 12,549,689 | -32,826 | -0.26% |
| Puerto Rico* | 3,205,691 | -14,422 | -0.45% |
| Louisiana | 4,573,749 | -14,274 | -0.31% |
| Pennsylvania | 12,961,683 | -10,408 | -0.08% |
| Oregon | 4,233,358 | -6,021 | -0.14% |
| Hawaii | 1,435,138 | -4,261 | -0.30% |
| West Virginia | 1,770,071 | -3,964 | -0.22% |
| Alaska | 733,406 | +130 | +0.02% |
| Vermont | 647,464 | +354 | +0.05% |
| Mississippi | 2,939,690 | +762 | +0.03% |
| New Mexico | 2,114,371 | +895 | +0.04% |
| Rhode Island | 1,095,962 | +2,120 | +0.19% |
| Wyoming | 584,057 | +2,428 | +0.42% |
| New Hampshire | 1,402,054 | +3,051 | +0.22% |
| Kansas | 2,940,546 | +3,830 | +0.13% |
| Michigan | 10,037,261 | +3,980 | +0.04% |
| North Dakota | 783,926 | +5,014 | +0.64% |
| Maine | 1,395,722 | +6,384 | +0.46% |
| Iowa | 3,207,004 | +7,311 | +0.23% |
| District of Columbia** | 678,972 | +8,023 | +1.20% |
| Connecticut | 3,617,176 | +8,470 | +0.23% |
| South Dakota | 919,318 | +9,449 | +1.04% |
| Montana | 1,132,812 | +9,934 | +0.88% |
| Nebraska | 1,978,379 | +10,319 | +0.52% |
| Delaware | 1,031,890 | +12,431 | +1.22% |
| Kentucky | 4,526,154 | +14,591 | +0.32% |
| Maryland | 6,180,253 | +16,272 | +0.26% |
| Nevada | 3,194,176 | +16,755 | +0.53% |
| Massachusetts | 7,001,399 | +18,659 | +0.27% |
| Missouri | 6,196,156 | +18,988 | +0.31% |
| Wisconsin | 5,910,955 | +20,412 | +0.35% |
| Arkansas | 3,067,732 | +21,328 | +0.70% |
| Minnesota | 5,737,915 | +23,615 | +0.41% |
| Idaho | 1,964,726 | +25,730 | +1.33% |
| Ohio | 11,785,935 | +26,238 | +0.22% |
| Washington | 7,812,880 | +28,403 | +0.36% |
| Indiana | 6,862,199 | +29,925 | +0.44% |
| New Jersey | 9,290,841 | +30,024 | +0.32% |
| Oklahoma | 4,053,824 | +34,553 | +0.86% |
| Alabama | 5,108,468 | +34,565 | +0.68% |
| Utah | 3,417,734 | +36,498 | +1.08% |
| Colorado | 5,877,610 | +36,571 | +0.63% |
| Virginia | 8,715,698 | +36,599 | +0.42% |
| Arizona | 7,431,344 | +65,660 | +0.89% |
| Tennessee | 7,126,489 | +77,513 | +1.10% |
| South Carolina | 5,373,555 | +90,600 | +1.71% |
| Georgia | 11,029,227 | +116,077 | +1.06% |
| North Carolina | 10,835,491 | +139,526 | +1.30% |
| Florida | 22,610,726 | +365,205 | +1.64% |
| Texas | 30,503,301 | +473,453 | +1.58% |
Note: *Territory. **Federal district.
New York’s population shrank by approximately 102,000 people in 2023 compared to 2022. Most of that drop occurred in New York City, where the net population fell by 77,000 people. This is more than the amount by which California’s population shrank (75,000 people).
In conjunction with the Northeast and Western states’ declines, Southern states (Texas, Florida, and North Carolina to name a few) saw gains in the same period. In fact, Texas added nearly half a million people, a 1.5% gain, or three times the national average.
These patterns could indicate ongoing interstate migration. For example, between 2020 and 2021, more than 100,000 Californians moved to Texas. A 2021 New York Times analysis found that Texas in particular is teeming with jobs and good schools alongside a low crime rate. As a result it has become a preferred destination for those looking to maintain their quality of life for lower costs, compared to New York City and California.
Loading…


