
Historically, the biggest economies in the world have also been those that dominate international trade overseas.
Visual Capitalist’s Niccolo Conte and Bruno Venditti created the following graphic, using data from the Peterson Institute for International Economics (PIIE) and the World Trade Organization, to show how global export shares by value have changed over the last 150 years for some of the world’s top powers.
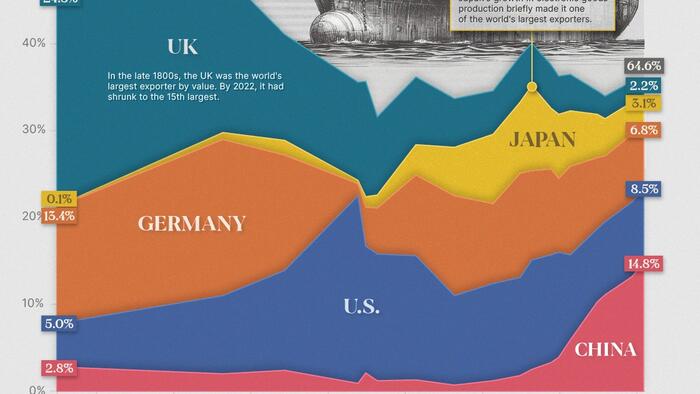
Merchandise Exports Share 1870-2022
During the 19th century, Britain was the world’s richest and most advanced economy. The economy was the most industrialized globally, with one-third of the population employed in manufacturing.
As a result, the UK’s finished goods were produced so efficiently and cheaply that they were widely traded worldwide, and were easily found in almost any other market.
Additionally, the British Empire benefited from its colonies, with India representing 42% of its exports by the end of the century.
During that period, Britain dominated merchandise exports, followed by Germany:
| Year | UK | Germany | U.S. | Japan | China | ROW |
|---|---|---|---|---|---|---|
| 1870 | 24.3% | 13.4% | 5.0% | 0.1% | 2.8% | 54.4% |
| 1913 | 18.5% | 18.0% | 9.0% | 0.8% | 2.0% | 51.7% |
| 1929 | 12.2% | 13.3% | 11.5% | 1.7% | 2.4% | 58.9% |
| 1948 | 11.3% | 1.4% | 21.6% | 0.4% | 0.9% | 64.4% |
| 1950 | 13.3% | 4.5% | 14.6% | 1.2% | 2.1% | 64.3% |
| 1953 | 9.0% | 5.3% | 14.6% | 1.5% | 1.2% | 68.4% |
| 1963 | 7.8% | 9.3% | 14.3% | 3.5% | 1.3% | 63.8% |
| 1973 | 5.6% | 11.5% | 10.3% | 5.6% | 0.7% | 66.3% |
| 1983 | 5.0% | 9.2% | 11.2% | 8.0% | 1.2% | 65.4% |
| 1990 | 5.3% | 12.0% | 11.3% | 8.2% | 1.8% | 61.4% |
| 1993 | 4.9% | 10.3% | 12.6% | 9.8% | 2.5% | 59.9% |
| 1998 | 5.0% | 9.9% | 12.4% | 7.0% | 3.3% | 62.4% |
| 2000 | 4.4% | 8.5% | 12.1% | 7.4% | 3.9% | 63.7% |
| 2003 | 4.2% | 10.2% | 9.8% | 6.4% | 5.9% | 63.5% |
| 2010 | 2.7% | 8.2% | 8.4% | 5.0% | 10.3% | 65.4% |
| 2012 | 2.6% | 7.6% | 8.4% | 4.3% | 11.1% | 66.0% |
| 2019 | 2.4% | 7.8% | 8.6% | 3.7% | 13.2% | 64.3% |
| 2022 | 2.2% | 6.8% | 8.5% | 3.1% | 14.8% | 64.6% |
After World War II, the U.S. overtook British and German export leadership.
Unlike Europe and many other parts of the world that experienced devastation and economic hardship due to the war, the U.S. emerged relatively unscathed in terms of physical destruction and with a significantly strengthened industrial base.
Asian Growth from the 1980s to the Present
During the 1980s and 1990s, Japan experienced rapid export growth, driven by electronics-related goods, and became one of the largest trading partners of the United States.
Today, China dominates the trade market, accounting for almost 15% of all merchandise.
China’s manufacturing industry has become a leader in producing almost anything from commonplace household items to integral pieces in automotive manufacturing. Some staples of Chinese manufacturing are:
Since 1948, global merchandise exports have grown from $59 billion to $24.3 trillion in 2022.
Loading…